Welcome to AlgoBars. The complete algorithmic trading platform.
What's AlgoBars?
AlgoBars builds auto trading bots for you. Tell it your idea in plain English. It writes the strategy, tests it on real past prices, and sends it live to your broker. You never write code.
What this cost before AlgoBarsTraders report spending $50,000 and seven years or more before finding AlgoBars. Most of them quit after the endless back and forth with coders. And the constant hunt for someone who could build their bots.
AlgoBars does it in seconds. For less than a cup of coffee (86 cents on average) it builds your algos, your strategies, your indicators. Or anything else you dream up. If you can think it, AlgoBars can make it.
Anything you can say, you can build. An indicator of your own. A full strategy. A dozen setups working together as one system. If you can describe it, the AI builds it. The list doesn't end.
What You Get Out Of It
Forget the feature list for a second. Here's what you walk away with.
- Your idea becomes a live bot. Say it in plain English. The AI writes the strategy, tests it on real history, and sends it live to your broker. You never touch code.
- You stop staring at charts. The scanner hunts setups across every market while you sleep. Alerts think before they ping you. Your strategies keep trading when your computer is off.
- You know before you risk a cent. Every idea is tested candle by candle on real history, then shuffled a thousand ways. You see your worst case up front, not after it costs you.
- One bot becomes a portfolio. Run trend, breakout, and mean-reversion systems side by side. Different markets. Different timeframes. All at once, all automatic.
- Your edge stops being a guess. The AI tells you why a backtest wins or fails. You fix the real problem instead of guessing at it.
- You get your time back. No code. No quant team. No screen time. Built the old way, this costs hundreds of thousands of dollars and years of your life. Most traders quit before it works. You skip all of it.
- You grow into it. Start free. Copy a proven trader while you learn. Sell your own strategies once you're good. Run it like a business when it's working.
What it costsEvery feature runs on every account, free. Nothing is locked. You only pay for how much you use, with Strategy Build Credits you top up as you go and no subscription. Click here to see pricing.
Create Your Account
Signing up is fast and free. No credit card required. Once you create your account, you'll have immediate access to live charts, paper trading, the Algo Builder, and 200+ broker connections.
- Click “Sign Up” to switch to registration mode on the login page.
- Enter your full name, a unique username (availability is checked live as you type), and your email address.
- Enter your phone number. Pick your country from the dropdown to get the right country code.
- Create a strong password. Toggle the eye icon to verify your password is typed correctly.
- Enter a referral code if you've one. Referral codes unlock bonus benefits and bonus credits.
- Hit “Create Account” and you're in! A cool animation plays while your account is being set up.
Sign In to the Platform
Come back to the login page whenever you want to jump back in.
- Enter your email or username in the login field.
- Type your password. Use the eye toggle to verify your input.
- Click “Sign In” and you'll be taken straight to your charts, exactly how you left them.
- Forgot your password? Click “Forgot Password?” for an instant reset link sent via email.
- Everything you set up before. Your chart layouts, indicators, and settings. Are saved and waiting for you.
Your First Look
You'll land on the main Platform Page. This is where everything happens.
- The Command Center slides out from the left edge. It holds every function.
- The credits battery sits in the header. It shows the Strategy Build Credits you've left.
- A Broker Selection popup may appear on your first login. Just pick the broker you want to trade with.
- Live prices start streaming automatically. You don't need to do anything to turn this on.
- Minimize a panel and it becomes part of the header. Click the button to bring it back.
Cross-Device Email Verification
We email you a magic link. Open it on any device. Your phone is fine. The tab where you signed up moves on by itself.
Legal Agreements
The first time you use a new feature, we show you the terms. Accept them once. We save that to your account. If the terms change, we ask you again.
- Touch the left edge. The Command Center slides out.
- Click Chart. Your first chart opens.
- Click AI Chat. Ask it to build you something.
The platform gets out of your way. Your whole menu slides in from the left. Each chart carries its own tools. So your charts get the screen.
The Command Center
The Command Center is your main menu. It holds every function. It slides out from the left edge of the screen. Touch the left strip with your pointer and it opens fast. Click the pin to keep it open.
- Chart. Open a new chart window.
- Positions. Every open trade, live and historic saved.
- Market Watch. Every market you can trade, ranging from FX, cryptocurrency, stocks, indices, commodities, equities, and more.
- Alerts. Let the platform watch for you.
- Trade Calculator. Get your lot size right and know the exact risk per position. Free on AlgoBars.
- Trade Journal. See how you really did, with deep trade analysis. Free on AlgoBars.
- Wallet. Your money and your Strategy Build Credits.
- AI Chat. Ask the AI to do the work. If you can think it, AlgoBars can make it.
- AlgoBuilder. Build a strategy as simple or as complex as you need.
- Indicator Matrix. Blend indicators into one, simplifying a complex workflow down to a single indicator.
- Algo Social. The trader network and marketplace. Copy traders, or share your strategies and custom indicators with the world.
- Layouts. Save your setup. Load it later.
Good to know Take advantage of a seamless UI built for traders to use in real time. Click an item you already have open and it just focuses that panel.
Talk To It: Hey AL
You don't have to type. Turn on active listening. Then just talk.
- Say “Hey AL” and your command in one breath. Like “Hey AL, do a full analysis on BTC.” It goes straight to the AI.
- Say “Hey AL” on its own and AL answers “Yes?” Then say what you want.
The chat can stay tucked away the whole time. AL reads the answer back to you out loud.
The chat window has three buttons of its own:
- New. Start a fresh chat.
- Chats. A drop down of every past chat. A red dot shows unread replies.
- Hide. Tuck the chat away without losing it.
Chart Windows & Toolbar
Each chart is its own window. It has its own market, timeframe, chart type, and indicators.
- Drag the title bar to move it.
- Resize from any edge or corner. The chart redraws to fit.
- Maximize to fill the screen. Click again to go back.
- Minimize to tuck it away. It becomes part of the header. Prices keep updating.
Every chart has its own toolbar across the top. That's where its tools live:
- Markets. Pick what you're looking at.
- Timeframe and chart type. Swap either one instantly.
- Range size. Set the pip distance for Range Bars.
- TradeCheck. Read this market across many timeframes at once, and run a deep-dive market analysis.
- Market Scanner. See what's setting up across markets.
- Indicators. Add any of the 100+ to this chart.
- Tools. Every drawing tool, plus colours and clear.
Layouts & Modes
- Modular mode tiles your panels into a neat grid.
- Free-Size mode lets you drop them anywhere you like.
- Auto arrange in the header snaps it all back into order.
- Layouts saves your whole setup so you can load it later.
- Ghost mode glows purple when it's armed, hiding your orders from the order book.
The header The header is packed with quick tools on purpose. It keeps your Chart, AlgoSocial, AlgoBuilder, and your other everyday functions to hand, along with the Strategy Build Credits battery that fills when your plan refills and drains as the AI works. Any chart you minimize drops into the header until you need it.
Account holds your security, brokers, billing, and settings. Spend five minutes here once. The rest of the platform then works your way.
Security Settings
Keep your account safe with these security options.
- 2FA Authentication. Add an extra layer of security with Google Authenticator or a text message code when you log in.
- Session Management. View all active sessions and revoke access from any device.
- Password Change. Update your credentials with strong password validation.
- Login History. Track all access attempts with IP address, browser, and timestamps.
Preferences & Broker
Make the platform work the way you want.
- Theme. Dark mode or light mode (default) for optimal chart reading.
- Sound Effects. Trade alerts, order fills, and notification sounds with volume control.
- Timezone. Display all times in your local timezone for accurate session tracking.
- Default Lot Size. Pre-set your usual position size for faster one-click execution.
- Broker Selection. Choose and configure your broker connection for live trading.
- Referral Program. View referral analytics, share your referral code, earn rewards and discounts.
Demo Mode: Practice With Simulated Money
Trade with simulated money on the real platform. Same charts. Same tools. Same everything. Nothing at risk.
- Click your profile in the header.
- Find the Demo / Live toggle.
- Click it. A yellow DEMO badge appears, so you always know where you are.
You get a simulated balance to trade with. Every feature works the same way. Place trades. Try things. Get them wrong. None of it costs you a cent.
Switch back the same way. A green LIVE badge means you're trading for real again.
Good to knowDemo and Live keep separate balances, positions, and history. Nothing you do in Demo touches your real account. It's the best way to learn the platform before you put money on it.
Workflow Tips
Small habits that save you real time.
- Save your layout. Get your whole multi-chart setup back with one click.
- Use templates. Drop a whole indicator set onto a chart as one preset.
- Go multi-monitor. Pop chart windows out to a second screen.
- Open any chart.
- Click the chart type menu on top.
- Pick Range Bars. Watch the noise drop away.
Pick the chart that fits how you trade. Love raw candles? Use them. Want less noise? Use Range Bars. Your drawing tools act the same on every chart type.
7 Chart Types Available
You can change chart types anytime from the dropdown menu at the top of each chart.
- Candlestick. Traditional Japanese candlesticks. The classic OHLC view most traders default to.
- Heikin-Ashi. Smoothed candles for trend identification. Filters out noise so trends become easier to see.
- Range Bars. Price-based bars that ignore time. A new bar only forms when price moves a set distance.
- X-Ray Range. See the real price path inside each Range Bar.
- Renko. Brick charts for pure price action. Each brick prints when price moves a set amount, ignoring time entirely.
- Line. Simple closing-price line for a clean, uncluttered view.
- Area. Filled area chart. Great for at-a-glance trend direction.
13 Timeframes Available
Switch timeframes via the toolbar dropdown on any chart. You get six timeframes measured in seconds, plus seven more from one minute up to one day. That's thirteen in all. Every timeframe works across Candlestick, Heikin-Ashi, Renko, Line, and Area. Prices update live. Switching is instant with no page reload.
Seconds: 1s 3s 5s 10s 15s 30s
Minutes and up: 1m 5m 15m 30m 1h 4h 1d
Range Bar Intervals
Range Bars work differently. Instead of time, they form based on price movement measured in points or pips. You can set any interval you want, from 1 pip up to as many pips as needed.
- Set any custom interval from 1 pip and up.
- Use the quick-switch presets to jump to common pip sizes: 20 40 80 and up. Each preset is double the one before it.
- A new bar only prints when price actually moves the set distance. No bars form during sideways or low-volatility periods.
Heads upevery chart type is free. Range Bars and X-Ray Range Bars are open from your first login.
A time chart draws a new bar every few minutes. Even when nothing happens. A price chart only draws one when price really moves. So you see the real action. Dead time drops off the chart.
X-Ray Range Bars (AlgoBars Exclusive)
The most powerful chart type on AlgoBars. Shows you what's really happening inside each bar.
- Internal movement visualization shows you the actual path price took inside each bar, not just where it opened and closed.
- Hidden wick detection reveals reversal wicks and internal fluctuations that standard candles hide.
- Micro-candles inside each bar are like zooming into a lower timeframe within every single bar to see what really happened.
- Pressure shading uses color to show whether buyers or sellers were stronger inside each bar.
- Deep order-flow insight shows you buying and selling pressure. You pay nothing extra for an order-flow feed.
Range Bars
Charts that ignore time entirely. New bars only print when price actually moves.
- Pure price movement means each bar closes only when price moves a fixed distance. For example, a 10-pip Range Bar only closes after price has moved a full 10 pips.
- Range Bars cut out the noise. No more tiny candles piling up during quiet hours when nothing is happening.
- The chart adapts to market activity. You'll see more bars when the market is busy and fewer when it's quiet. Exactly what a trader needs.
- Cleaner breakouts appear without false signals from time-decay or low-volume drift.
- Custom intervals let you pick any pip distance. Or use the quick presets (20, 40, 80, and up) to scale fast.
Heikin-Ashi
Modified candlesticks that average out price data for smoother, cleaner trends.
- Trend smoothing reduces choppy back-and-forth movements that confuse standard candles.
- Color streaks signal trends. When you see several candles of the same color in a row, that's a strong trend forming.
- Heikin-Ashi filters out fake reversals. A candle has to actually change direction to flip color, so noise doesn't trick you.
- Works with everything. Supports all your regular indicators and drawing tools, just like standard charts. Free for everyone.
Renko
Fixed-size bricks that only print when price moves a set amount.
- Pure price filter. A new brick only appears when price moves the set amount, ignoring all small wiggles in between.
- Renko is time-independent. A single brick can take seconds or hours to form, depending on volatility.
- Trend clarity comes from same-color bricks stacking in a row when there's a clean trend. Reversals show as the first brick of a new color.
- Renko is great for breakouts. Clean visual signals for breakouts and trend changes without time-based clutter. Free for everyone.
Pick the Right Chart for the JobUse Candlestick or Heikin-Ashi for general analysis and indicator-based strategies. Use Range Bars or Renko when you want to filter noise and focus on price movement. Use X-Ray Range Bars when you need to understand what's happening inside each bar, especially around key levels, breakouts, and reversals.
Keep many charts open at once. Each one is its own. Its own market. Its own timeframe. Its own chart type and indicators.
Multi-Chart System
- Open as many as you want. No hard limit on how many charts you can have open at the same time. Watch every market that matters.
- Auto-arrange grid. The Grid icon tiles up to 6 charts evenly (2×2, 1×4, 2×3, etc.) with one click. Any additional charts you open beyond that float on top as draggable windows.
- Independent windows. You can drag, resize, maximize, or minimize any chart on its own without affecting the others.
- Linked crosshairs. Hover on one chart and the crosshair position mirrors across every other open chart at the same time.
Popular LayoutsFour go-to setups that traders use every day.
- Multi-timeframe. Same symbol on H4, H1, M15, and M5 for top-down analysis.
- Correlation. EURUSD and DXY side by side to spot direct or inverse moves.
- Multi-asset. Gold, Oil, S&P 500, and Bitcoin all at once.
- Strategy development. Standard candlestick, X-Ray Range, and Renko views of the same market for direct comparison.
Mark up your chart from the top toolbar. Draw trend lines, zones, Fibonacci, and notes. The Trade Calculator does your lot size math. One click sends it to your trade panel.
Drawing Tools
All the drawing tools you need to mark up and analyze your charts.
- Trend Lines let you draw support and resistance with automatic angle and slope display.
- Horizontal Lines mark key price levels that persist across all timeframes.
- Fibonacci Retracement draws Fib levels (23.6%, 38.2%, 50%, 61.8%, 78.6%) between any two swing points.
- Fibonacci Extension projects targets at 127.2%, 161.8%, and 261.8% beyond the measured move.
- Rectangle Zones highlight supply/demand zones, order blocks, or consolidation areas.
- Price Range tool measures distance in pips, percentage, and duration between any two points on the chart.
- Text annotations let you add labels and notes directly to the chart for your trading journal.
Trade Calculator: Lot Size & Position Engine
This tool tells you exactly how many lots to trade. It works from your risk. It's wired straight to the Quantum Trade Panel. Open it as Trade Calculator from the Command Center on the left or top menu. Calculate, then apply with one click.
How to use the Trade Calculator:
- Open Trade Calculator from the Command Center on the left or top menu.
- Account Balance auto-fills with your current account balance. You can manually type a different number if you want to calculate for a hypothetical balance.
- Risk Percentage is the percentage of your balance you're willing to risk on this trade (for example, 1% or 2%). The calculator instantly shows the dollar amount that equals.
- Stop-Loss (in pips) is how far away your stop-loss will be in pips. The bigger the stop, the smaller the lot size needs to be to keep your risk the same.
- Take-Profit (in pips) is optional. Enter your take-profit distance to see your potential reward amount and risk-to-reward ratio.
- The calculator instantly shows your Lot Size: the exact position size that risks only the percentage you chose.
- Click "Apply to Trade Panel" and the calculated lot size, stop-loss, and take-profit are sent directly to the Quantum Trade Panel, ready to execute.
What the calculator shows you:
- Lot Size is the big number at the bottom. The exact lot size that risks your chosen percentage given your stop distance.
- Risk Amount ($) shows how many dollars you're risking on this trade.
- Reward Amount ($) shows how many dollars you'd make if price hits your take-profit.
- Risk-to-Reward Ratio displays the ratio (for example, 1:2 means you'd make $2 for every $1 risked). Color-coded: green for good ratios, red for poor ones.
- Pip Value shows the dollar value of each pip for the current instrument at the calculated lot size.
- Current Price displays the live bid price of the instrument you're viewing.
The math behind it. The formula is simple: Lot Size = Risk Amount ÷ (Stop Loss in Pips × Pip Value per Lot). The calculator handles all the tricky parts. Like different pip sizes for forex versus crypto versus indices, and different contract sizes per instrument. You just enter your risk percentage and stop distance.
Connected to your chartThe calculator automatically knows which instrument you're looking at and pulls the current price. It also knows the correct pip size and contract size for that instrument. Whether it's EURUSD (pip = 0.0001), BTCUSD (pip = 0.01), or Gold (pip = 0.01). No manual setup needed.
Spread Monitor
Keep an eye on trading costs.
- Spread display shows the current spread (difference between buy and sell price) for every instrument in the Market Watch panel.
- Spreads are shown in pips and dollar value so you know exactly what the cost of entry is.
- Tighter spreads mean lower cost to enter a trade. Compare spreads before choosing which instrument to trade.
- Open a chart. Click Indicators.
- Type RSI. Click it.
- It lands on your chart. Add more the same way.
Every indicator you need, in six groups. Moving averages. Momentum. Volatility. Trend. Volume. Patterns. Pick one and it lands on your chart right away.
Moving Averages
Drawn directly on the price chart. Smooth out price noise to see the underlying trend. Use them as dynamic support and resistance, or as trend filters in your strategies.
SMA, EMA, WMA, DEMA, TEMA, HMA, VWMA, VWAP.
Momentum & Oscillators
Show in their own panel below the chart. Measure how fast price is moving and where it's overbought or oversold. The classics most traders learn first.
RSI, MACD, Stochastic, StochRSI, CCI, Williams %R, MFI, ROC, Momentum, TSI, Ultimate Oscillator, Awesome Oscillator, PPO, Aroon, CMO.
Volatility
Some draw on the chart, some show in a panel. Measure how far and fast price is swinging. Great for filtering choppy markets and sizing risk.
ATR, NATR, Bollinger Bands, BB Width, BB %B, Keltner Channel, Donchian Channel, Envelope, Std Dev, Chaikin Volatility, RVI, Ulcer Index, Mass Index, Historical Volatility.
Trend
Drawn directly on the price chart. Identify the direction and strength of moves. Perfect for trend-following strategies and as filters before entry signals.
Supertrend, ADX, +DI, −DI, ADXR, Parabolic SAR, Ichimoku Cloud, Vortex, Linear Regression, LinReg Slope, Chandelier Exit.
Volume
Show in their own panel below the chart. Confirm price moves with participation. If price moves on heavy volume, the move is more credible.
Volume, OBV, A/D Line, A/D Oscillator, CMF, EFI, EOM, NVI, PVI, VPT, VROC, Volume Oscillator, PVO.
Patterns & Signals
Auto-detected and marked directly on the chart. Pre-built signal indicators that watch for chart patterns and key conditions, then mark them with arrows and shapes.
Pivot Points, Fibonacci Levels, ZigZag, Fractals (Up / Down), MA Cross, MACD Cross, RSI Signals, BB Squeeze, Inside Bar, Engulfing, Doji, Period High / Low.
Indicator CombosTry combining a trend indicator like EMA with a momentum one like RSI for stronger signals. You can even automate these combos in the Algo Builder. No coding needed. Also check out the Indicator Glossary at algobars.com/glossary. It's a full encyclopedia with formulas, parameters, signal examples, and usage tips for every single indicator.
Build Your OwnYou can even combine any of these indicators into a brand new custom one using the Indicator Matrix. Pick your base indicators. Choose how to blend them. Save it as your own. It takes a few clicks. No code. It's free for everyone.
Make your own indicator. Take two you trust. Blend them into one. Save it. Now use it on any chart or in any strategy.
What's the Indicator Matrix?
Reading five indicators takes time. Blend them into one instead. Think of mixing paint. You take colors you know and make a new one. The Indicator Matrix does that with indicators.
- Found inside the Algo Builder panel. Click the “Indicator Matrix” tab at the top.
- Combine any 2 or more indicators into a single fused output.
- Choose exactly which part of each indicator you want. For example, just the RSI value, or just the MACD histogram, or just the upper Bollinger Band.
- Your custom indicator shows up right on the chart alongside your other indicators.
- Saved to the cloud. Available across all your devices and sessions.
How to Create a Custom Indicator: Step by Step
Here's exactly how to build your first fused indicator.
- Open Indicator Matrix from the Command Center on the left or top menu.
- Click “Add Layer” to add your first indicator. Pick from the list (SMA, EMA, RSI, MACD, Bollinger Bands, Stochastic, and many more).
- Choose which output you want from that indicator. For example, MACD has three outputs: MACD Line, Signal Line, and Histogram. Pick the one you need.
- Set the parameters (like period length) and give the layer a color.
- Add a second layer (or more) by clicking “Add Layer” again and picking another indicator.
- The AI Chat blends the layers for you. It sets how they combine, based on what you ask (see below).
- Adjust the weight of each layer if you want one indicator to have more influence than the other.
- Pick a visualization style: Line, Area, Bars, Histogram, Dots, or Step.
- Give it a name and click Save. Your custom indicator is now available to use on any chart.
Blend Modes: How Layers Combine
The AI sets the math behind how your indicator layers merge together. Here's what each one does in simple terms:
- Average takes the middle value of all layers. Great for smoothing out two signals into one.
- Weighted is the same as average, but you control how much weight each layer gets (for example, 70% RSI + 30% CCI).
- Difference subtracts one indicator from another. Shows the gap between two signals.
- Multiply multiplies the layers together. Useful for amplifying signals when both agree.
- Ratio divides one indicator by another. Shows the relative strength between two indicators.
- Maximum takes whichever indicator has the highest value at each point.
- Minimum takes whichever indicator has the lowest value at each point.
- Crossover detects the moment when one layer crosses above or below another. Gives you a +1 or -1 signal at the crossing point.
Visualization Types
Choose how your custom indicator looks on the chart.
- Line is a clean continuous line. Best for trend-style indicators like moving averages.
- Area fills the space below the line. Helps the eye spot the indicator from across the chart.
- Bars display each value as a vertical bar. Useful for showing magnitude.
- Histogram is similar to bars but centered on a zero line, so positive and negative values show clearly.
- Dots plot each value as a single point. Clean look for less-frequent signals.
- Step is a stair-step line that holds each value until the next one. Great for showing discrete state changes.
Extra Features
A few more things you can do with your custom indicators.
- Formula view. As you build, the platform shows you the mathematical formula in real-time (for example,
avg(RSI(14), CCI(20))). - Auto short name. A compact label is generated automatically so your indicator fits neatly on the chart legend.
- Auto-placement. The system figures out if your indicator belongs on the main price chart (like a moving average) or in a separate panel below (like an oscillator).
- Delete and edit. Manage your library of custom indicators anytime. Edit the layers, change colors, or delete ones you no longer need.
- Use in Algo Builder. Once saved, your custom indicators can be used as conditions inside your trading strategies.
Good to knowthe Indicator Matrix is free for everyone. Building and saving a custom indicator uses Strategy Build Credits, like any other AI job.
You don't have to memorize every candle pattern. AlgoBars watches your chart live. It labels each pattern the moment it forms. It tells you if the read is bullish or bearish. Turn this on or off in the Market Scanner module.
Single-Bar Patterns
These patterns are found from a single candle's shape.
- Doji is a neutral indecision candle where open and close are nearly equal.
- Hammer is a bullish reversal signal that often appears at the bottom of a downtrend.
- Shooting Star is a bearish reversal signal that often appears at the top of an uptrend.
- Marubozu is a strong continuation candle with no wicks, signaling unbroken pressure in one direction.
- Spinning Top is a neutral indecision candle with a small body and long wicks on both sides.
- Dragonfly is a bullish doji with a long lower wick. Buyers rejected lower prices.
- Gravestone is a bearish doji with a long upper wick. Sellers rejected higher prices.
- Pin Bar is a reversal signal where one side has a long wick that pierced into a key level and got rejected.
- Long Wick is a rejection candle showing strong push in one direction that was completely reversed.
Multi-Bar Patterns
These patterns need two or three candles in a row to form.
- Engulfing Bull (2-bar) is a strong bullish reversal where a green candle completely swallows the previous red candle's body.
- Engulfing Bear (2-bar) is the bearish opposite: a red candle that swallows the previous green one.
- Harami Bull (2-bar) is a bullish reversal where a small green candle sits inside the body of a previous larger red candle.
- Harami Bear (2-bar) is the bearish opposite of Harami Bull.
- Tweezer Top (2-bar) is a bearish reversal with two candles topping out at exactly the same high.
- Tweezer Bottom (2-bar) is a bullish reversal with two candles bottoming at exactly the same low.
- Inside Bar (2-bar) is a consolidation pattern where the second candle's range fits entirely inside the first candle's range.
- Piercing (2-bar) is a bullish reversal where a green candle closes above the midpoint of the previous red candle.
- Dark Cloud Cover (2-bar) is the bearish opposite of Piercing.
- Morning Star (3-bar) is a strong bullish reversal: a red candle, a small indecision candle, then a green candle that pushes back up.
- Evening Star (3-bar) is the bearish opposite of Morning Star.
- 3 White Soldiers (3-bar) is a strong bullish continuation: three large green candles in a row, each closing higher.
- 3 Black Crows (3-bar) is the bearish opposite of 3 White Soldiers.
- Fakey (2-bar) is a trap pattern where price breaks above or below an Inside Bar but quickly reverses, faking out breakout traders.
- Open a chart. The trade ticket sits right on it.
- Set your lot size. The Trade Calculator can do it for you.
- Click Buy or Sell. Drag your stop right on the chart.
Placing a trade takes one click. The Quantum Trade Panel holds six order types. That includes hidden Ghost Orders. Risk tools are built in. Right-click the chart to order at that price. Drag your stop and target into place. It all works on mobile too.
Quantum Trade Panel
This is your main trading panel. Everything you need to place a trade is right here.
- One-Click Trading executes instantly with pre-set lot size, stop-loss, and take-profit. The first time you use it, a safety disclaimer pops up asking you to confirm you understand the risks of instant execution. Once accepted, trades execute with a single click.
- Smart Lot Calculator figures out the right trade size for you based on how much you want to risk and where your stop-loss is.
- Visual Stop-Loss / Take-Profit Lines can be dragged directly on the chart. Your risk-to-reward ratio updates live as you drag.
- Risk Display shows the exact dollar risk and reward-to-risk ratio before you click execute.
- Order type support covers Market, Limit, Ghost, and Trailing Stop orders all from the same panel.
Order Types Explained
Here's a simple breakdown of each order type and when to use it.
- Market Order buys or sells right now at the current price. The fastest way to enter a trade.
- Limit Order sets a price you'd like to buy or sell at. The trade only happens when the price reaches your level.
- Stop Order triggers a trade when price moves past a certain level. Great for catching breakouts.
- Stop-Limit works like a Stop Order but also lets you set the maximum price you're willing to pay. Gives you more control.
- Ghost Order is a stealth order that only exists on AlgoBars. Your broker never sees it. Shown in purple on the chart. See the Ghost Orders section below for the full explanation.
- Trailing Stop follows the price as it moves in your favor. Locks in profits automatically. Your stop moves up as the price goes up or down.
Ghost Orders & Ghost Stop-Loss / Take-Profit
Ghost features keep your orders and stop levels invisible to your broker and market makers. So they can't hunt your stops.
- What's a Ghost Order? It's a pending order that only lives on AlgoBars. Unlike a regular limit order (which goes to your broker), a Ghost Order stays completely hidden. When the price hits your level, AlgoBars smart routing technology automatically sends a market order to your broker at that exact moment.
- What's Ghost Stop-Loss / Take-Profit? Normally, your stop-loss and take-profit are sent to your broker, meaning market makers can see them. With Ghost mode turned on, your stop-loss and take-profit are never sent to the broker. Instead, AlgoBars watches the price and closes your trade when the ghost levels are hit.
How to use Ghost Orders:
- In the Quantum Trade Panel, click the “Ghost” tab at the top (next to Market and Limit). The panel turns purple.
- Set your entry price. The price level where you want to enter the trade.
- Set your lot size, stop-loss, and take-profit just like a normal trade.
- Click Buy or Sell. Your order is now placed. It shows up as a purple dashed line on the chart and as a “GHOST” badge in the Pending Orders tab.
- When the market price reaches your entry, AlgoBars fires a market order to your broker automatically.
How to use Ghost Stop-Loss / Take-Profit:
- In the Quantum Trade Panel, look for the Standard / Ghost toggle next to the stop-loss and take-profit fields.
- Click the ghost icon to switch from Standard mode to Ghost mode. The toggle turns purple.
- Set your stop-loss and take-profit as usual (in pips or price).
- Place your trade. Your stop-loss and take-profit aren't sent to the broker. They're kept safely hidden within your account.
- AlgoBars monitors the price in real-time and closes the position the moment a ghost level is hit.
Why use Ghost mode?Some brokers can see stops in their order book at large scale. Price may get pushed to hit it, then turn back. Traders call this “stop hunting.” Ghost mode hides your levels. Brokers only see an open trade with no stop on it.
ImportantGhost stop-loss and take-profit depend on AlgoBars being able to monitor the price. If you lose internet connection, ghost levels won't trigger until you reconnect. For critical protection, consider using standard stops as a safety net alongside ghost levels.
Risk Management Built-In
Built-in tools to make sure you never risk more than you're comfortable with.
- Max risk per trade can be set as a percentage of your total account balance.
- Automatic lot sizing is based on where your stop-loss is and how much you want to risk. No calculator needed.
- Visual risk-to-reward ratio is shown before you enter. So you always know how much you could make versus how much you're risking.
- Partial close lets you take profits in stages by closing a percentage of your position.
- Negative balance protection prevents your account from going below zero. If a trade goes badly, you'll never lose more than your balance.
Right-Click Quick Orders on Chart
Right-click anywhere on the chart to instantly place orders at that exact price. No need to type numbers into the trade panel.
- Right-click on empty space. A quick-order menu pops up at your cursor showing the exact price. Choose Pending Buy, Pending Sell, Ghost Buy, or Ghost Sell and the order is placed instantly at that price level.
- Right-click on an entry line to close the position or modify its stop-loss and take-profit.
- Right-click on a stop-loss or take-profit line to remove it with one click.
- Right-click on a pending or ghost order line to cancel the order immediately.
- Right-click on a drawing (trend line, rectangle, etc.) to delete the drawing.
- Stop-loss and take-profit values from your trade panel are automatically applied to quick orders. So your risk settings carry over.
Drag-to-Create Stop-Loss & Take-Profit
Create and move your stop-loss and take-profit by dragging directly on the chart. The fastest and most visual way to manage your risk.
- When you've an open trade, you'll see the entry line on the chart (green for buys, red for sells).
- Drag from the entry line downward on a buy trade to create a stop-loss at the exact level you want. Drag upward to create a take-profit. (For sell trades, it's reversed.)
- As you drag, you'll see the price level, pip distance, and dollar risk updating in real-time.
- Release to set the level. The stop-loss or take-profit is saved to your position immediately.
- Already have a stop-loss or take-profit? Just grab the existing line and drag it to a new level. Works for pending and ghost order lines too.
Mobile FriendlyThis is especially useful on mobile. Just tap and drag from your entry line to set levels visually. It's the same interaction on both desktop and touchscreen.
Two tools do your market reading for you. Both live in the toolbar across the top of every chart. TradeCheck reads one market in depth. The Market Scanner watches many at once. Both are locked to that chart's symbol, so what you see is always about the market in front of you.
Where These Live
Look at the toolbar along the top of any chart. Beside the chart type you'll find TradeCheck and Market Scanner. Everything else you need lives in the Command Center on the left or top menu.
- Market Scanner watches your chart in real-time for patterns you select (candlestick, price action, structure). See the full section below.
- Risk Calculator is a precision lot-size calculator. Tells you exactly how big a position to take based on your account and where your stop is.
- Trade Journal is a P/L calendar heatmap of every trade you've made. See Chapter 16 for the deep dive.
- Trade Check runs a full multi-timeframe analysis on any market and gives you an overall trade score, sentiment read, and calculated stop and take-profit. See the dedicated section below.
- Algo Builder turns a plain-English description into a full strategy you can test, save, or deploy, built by AI or generated in one click. See Chapter 17 for the deep dive.
- AlgoSocial is the community strategy hub for sharing, importing, and discovering strategies and custom indicators. Copy trade top performers or publish your own. See Chapter 28.
- Signal Radar generates automated trade signals with real-time market scanning status.
- Alert System triggers custom price alerts with Telegram and Discord notification integration.
- Backtest Lab is a historical simulation engine for testing strategies against past market data. See Chapter 20.
Trade Check: Multi-Timeframe Sentiment Analysis
Trade Check reads a market for you in one click. Pick a symbol. Pick your style. It checks many timeframes at once. You get one score from 0 to 100. You get a clear buy or sell read. You get a stop and a target. Trade it with one click.
How to use Trade Check:
- Open TradeCheck from the chart toolbar.
- Read and accept the Important Disclaimer (one-time per session).
- Pick your Trade Type: Scalping analyzes 1m / 5m / 15m timeframes, Intraday analyzes 15m / 1h / 4h, Swing analyzes 4h / Daily / Weekly.
- Pick your Direction: Buy or Sell.
- Pick your Risk Level: Low (5% per trade), Medium (20%), or High (50%).
- Click Analyze. The platform runs the analysis and returns a detailed report.
What Trade Check analyzes across each chosen timeframe:
- RSI for overbought / oversold conditions.
- MACD histogram for momentum direction.
- Price vs. SMA 20 for short-term trend.
- EMA 9 / 21 cross for momentum shifts.
- SuperTrend direction for trend confirmation.
- SMA 50 / 200 (Golden / Death Cross) for the long-term picture.
- Support and resistance levels auto-detected from recent swing points.
- ATR-based volatility classified as Low, Moderate, or High.
What you get back:
- Trade Score (0 to 100). A single number combining every signal across every timeframe. Above 75 is a Strong Signal, 50 to 74 is Moderate, below 50 is Weak.
- Trend classification of the market: Strong Bullish, Bullish, Sideways, Bearish, or Strong Bearish.
- Volatility read of Low, Moderate, or High based on ATR.
- Per-timeframe breakdown showing every signal (RSI, MACD, EMAs, SuperTrend, SMA cross) with its bullish or bearish status.
- Auto-calculated stop-loss and take-profit sized off ATR. Higher Trade Scores get wider take-profit targets (3R for strong, 2R for moderate, 1.5R for weak).
- Lot size is calculated from your account balance, risk percentage, and the stop distance, so it risks exactly what you set.
One-click execution. Once the analysis is done, you can edit the lot, stop, and take-profit if you want, then click Execute to place the trade directly. Or click Save Report to keep the analysis for later.
Market Scanner: Live Pattern Detection
The Market Scanner watches your chart in real-time and highlights any patterns it finds. You pick which patterns to look for. The scanner does the rest.
How to use the Market Scanner:
- Open Market Scanner from the chart toolbar.
- You'll see three expandable groups: Candlestick Patterns, Price Action, and Market Structure.
- Expand any group and click the toggle next to any pattern to turn scanning on for it. Active patterns light up in color.
- The scanner immediately starts looking for that pattern on your current chart. When a match is found, it gets highlighted directly on the chart with colored markers, zones, or labels.
- You can turn on multiple patterns at once. Scan for Doji + Engulfing + Order Blocks all at the same time.
- Click "Clear All" to turn off all scanners and remove the highlights from the chart.
What it can scan for:
- Candlestick Patterns (25+). Single-candle (Doji, Hammer, Shooting Star, Pin Bar, Marubozu), two-candle (Engulfing, Harami, Tweezer, Inside Bar, Piercing, Dark Cloud), and multi-candle (Morning Star, Evening Star, 3 White Soldiers, 3 Black Crows, Fakey).
- Price Action & SMC (20+). Break & Retest, S/R Breakout, Range Breakout, Trend Line Break, Order Block, Fair Value Gap, Liquidity Grab, Swing Failure, Break of Structure, Change of Character, Supply/Demand Zones, Flip Zones, Quasimodo, Breaker Block, Mitigation Block, OTE Zone, Inducement, and Judas Swing.
- Market Structure & Chart Patterns (30+). Swing High/Low, HH/HL/LH/LL, Equal Highs/Lows, Trend Direction, Consolidation, Head & Shoulders, Double Top/Bottom, Wedges, Flags, Pennants, Triangles, Cup & Handle, Channels, all Harmonic Patterns, and Elliott Wave structures.
How it appears on the chart. Different patterns show up differently. Candlestick patterns get colored markers above or below the candle. Supply/demand zones and order blocks appear as shaded rectangles. Structure breaks show connection lines and labels. Harmonic patterns draw the full XABCD shape with Fibonacci levels. Everything updates live as new candles form.
Quick Actions
Every module has quick-action buttons so you can get things done fast.
- Deploy pushes a strategy live with one click after backtesting.
- Backtest runs any strategy against historical data instantly.
- Monitor lets you watch live strategy performance and trade execution.
- Config tweaks the settings for any module to match how you like to trade.
A live trade still needs you. Use the Open Positions panel. Move your stop. Take part of a winner. Add a trailing stop. Or close it all at once. It updates live as price moves.
Position Controls
Here's how to manage trades that are already open.
- Modify stop-loss / take-profit. Click any open position to change your stop-loss and take-profit levels instantly. Or drag the lines directly on the chart.
- Partial close. Sell off part of your position to lock in some profit, while letting the rest keep running.
- Trailing stop. Stop-loss follows price at a fixed distance, locking in profits as the trade moves in your favor.
- Close all. A panic button that closes every open position across all instruments instantly.
Position Analytics
See live stats for every trade you've open.
- Profit/Loss display shows how much you're up or down on each trade, in both dollars and pips, updating live.
- Duration tracking shows how long each position has been open.
- Swap / Commission shows any overnight fees or broker commissions that have accumulated.
- Chart markers make your open trades show up as lines on the chart with entry, stop-loss, and take-profit levels visible at all times.
Market Watch holds every market you can trade. Browse by type. Or search a ticker. Star the ones you like. Double-click any to open its chart. Prices go live right away.
Asset Classes
All the markets you'd want to trade, available from one screen.
- Forex (28+ pairs). Majors like EURUSD, GBPUSD, USDJPY. Minors like EURGBP, EURJPY. Plus exotics.
- Crypto (20+ coins). BTC, ETH, SOL, ADA, DOT, LINK, AVAX, MATIC, and more altcoins.
- Indices. US30 (Dow), NAS100, SPX500, DAX40, FTSE100, Nikkei225.
- Commodities. Gold (XAUUSD), Silver (XAGUSD), Oil (WTI / Brent), Natural Gas.
- Stocks. Top US equities including AAPL, TSLA, NVDA, AMZN, MSFT (broker dependent).
Search & Filter
Finding any market is fast and easy.
- Type to search. Start typing and results filter instantly. Works with ticker symbols or full names.
- Category tabs let you switch between Forex, Crypto, Indices, Commodities, and Stocks.
- Favorites star () on any instrument adds it to your personal favorites list for quick access later.
- Live bid/ask prices update in real-time, color-coded green for up moves and red for down moves.
- Current spread for each instrument is shown right next to the price, so you can see costs before opening a trade.
- Double-click any instrument to instantly open a new chart window with that symbol loaded.
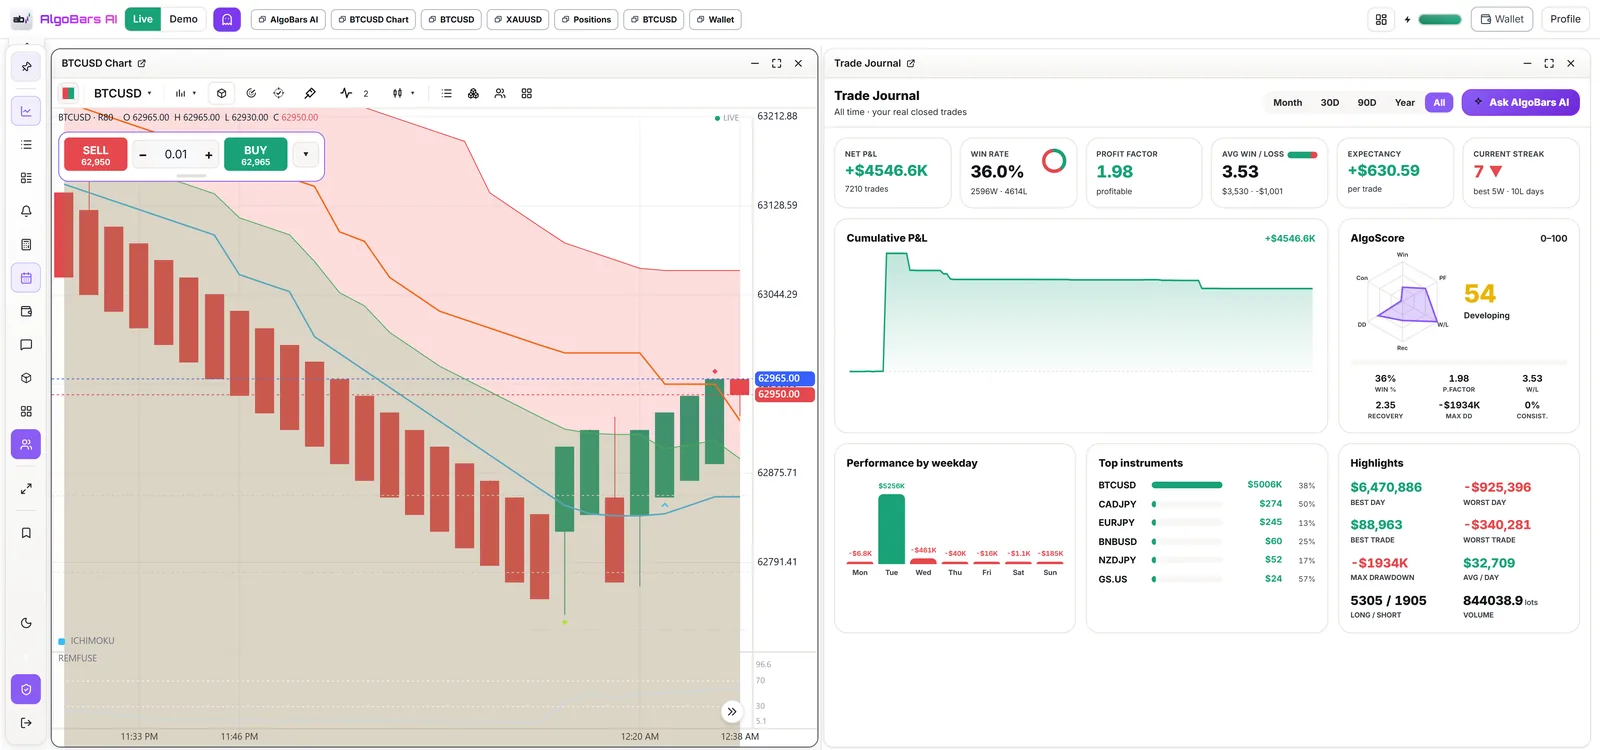
The Trade Journal is a full-suite performance dashboard built on your real closed-trade history, not a diary you've to fill in. It's wired to your account and refreshes automatically when you switch accounts.
What It Shows
- KPI cards summarizing your headline performance.
- Cumulative P&L equity curve of your account over time.
- AlgoScore radar: a multi-axis skill profile of your trading.
- Month calendar with per-day P&L, trade count, and win rate, plus weekly summary rows.
- Breakdowns by day of week and by symbol, plus best/worst trades and drawdown.
How to Use It
- Open the Journal panel in the workspace.
- Pick the trading account to analyze; the dashboard reloads for that account.
- Scan the calendar for your strong and weak days, then drill into the day-of-week and per-symbol tables to find patterns.
- Click Ask AlgoBars AI to send your journal context to the AI for a written analysis of what's working and what's not.
Big news can move a market in seconds. The calendar shows what's coming. And how hard it may hit. You see it right next to your charts. So no number catches you off guard.
Event Calendar
A calendar of upcoming economic events that could affect your trades.
- Real-time event feed. Upcoming economic releases sorted by time and impact level.
- Impact ratings. High (red), Medium (orange), and Low (yellow) impact events are color-coded for quick scanning.
- Country filters let you focus on events from specific regions like US, EU, UK, or Japan.
- Previous, forecast, actual values are shown side by side. Compare expected versus actual as data releases come in.
- Chart integration plots economic event markers directly on your price chart timeline. So you can see exactly when news hit and how price reacted.
Event Alerts
Set up reminders so you're always prepared for big events.
- Custom reminders can be set for specific events like NFP, FOMC, CPI, and GDP releases.
- Push notifications arrive 15 minutes before high-impact events. Plenty of time to flatten positions or get ready.
- Trade planning around the calendar helps you time your sessions around volatile news windows.
- Historical data lets you review how markets reacted to past events of the same type. Useful for predicting volatility patterns.
- Open Algo Builder.
- Type your idea in plain English. Like "buy when RSI 14 drops below 30".
- Click Build. The AI writes the strategy for you.
You don't need to code. Describe your strategy in plain English and the AI builds it for you. Whatever you make, you can test it, save it, share it, or run it live.
The old way, this took years and cost thousands. Here it takes a sentence and a few credits.
Type Your Strategy in Plain English
The fastest way to build. Just tell the AI what you want in your own words.
- Open the Algo Builder. It starts with one question: what do you want to build?
- Type your idea in plain words. For example: “Buy when RSI drops below 30 and price is above the 200 EMA”.
- Send it to the AI.
- The AI builds the full strategy. It picks the indicators, writes the entry and exit rules, and sets your risk. Then it reads back what it built in plain English so you can check it.
- The strategy is ready to test, tune, or deploy. You can change any part of it.
What can you type?Anything you want. Any analysis or ideas your brain can imagine can be automated. It doesn't have to be an indicator. You can feed it your past trade results, a report, or research from someone else, and turn any of it into a strategy. Use indicator names like RSI, MACD, or EMA. Use candle names like Doji or Hammer. Use price action terms like Order Block or Fair Value Gap. Add compare words like crosses above or drops below. Add numbers too. Try this: “RSI 14 below 30”.
One-Click Algo Generator
Don't want to build from scratch? Press one button and the AI builds a full strategy for you.
- The AI does the work. It picks the indicators, sets the conditions, and manages the risk.
- Ready to trade. Every strategy comes with entry rules, stop-loss, take-profit, and position size already set.
- Backtested up front. Each one is tested against real data, so you can compare many and keep the winners.
- Monthly limit. Your credits set how many you can make each month.
Test, Save, and Go Live
Check your strategy, keep it safe, share it, or push it live.
- Backtest in milliseconds. See win rate, profit factor, max drawdown, and your equity curve. These are past-data results, so real fees and spreads will change them.
- Stress-test it. Run Market Simulation and walk-forward tests to check it holds up on new data.
- Save and export. Save strategies to the cloud, or download one as a file for backup or sharing.
- Import strategies. Load strategy files from other users or from your own backups.
- Publish to AlgoSocial. Share with the community, public or by private link, so others can copy trade it.
- Deploy with Broker Bridge. Send it live to your broker so it runs 24/7. Ghost Orders keep your moves hidden.
You don't have to start from zero. The Strategy Templates library ships 99 ready strategies in 24 groups. Each one is written in plain English. One click loads it into Algo Builder. They're free.
What a Template Contains
- Plain-English rules. Every entry and exit condition is fully defined. No discretion required.
- Indicators used. The exact indicator stack the setup depends on (for example PDH/PDL Lines + VWAP + Volume).
- Configuration included. The timeframes, risk-to-reward targets, and risk level the template runs on.
- Performance parameters. Historical win rate, average R:R, and expected trade frequency (for example 5m/1H timeframe, 2:1 target R:R, conservative approach).
- Related strategies. Links to other templates in the same category so you can compare variants.
The 24 Categories
The 24 groups cover every style of trading. Key Levels and Chart Patterns. Candlesticks and Harmonics. SMC and ICT Advanced Models. Market Structure, Supply & Demand, and Order Flow. Volume Profile and Market Profile. Wyckoff, Elliott Wave, and Gann. Al Brooks price action and TD Sequential. Gaps, Range & Renko, Scalping, Swing, and Volatility. Plus Entry techniques, Patterns, and Advanced multi-rule systems.
How to Deploy a Template
- Open Strategy Templates and browse by category, or use Browse by Tag to search across the whole library.
- Open any template and review its Rules & Configuration: the full rule set, required indicators, and performance parameters.
- Click "Deploy This Strategy". The template imports into Algo Builder as a complete, editable strategy in one click.
- Backtest it in seconds against historical data before risking anything (see the Backtesting In Depth chapter).
- Customize any rule, then paper trade it or deploy live through the Broker Bridge.
Tips
- Templates are learning scaffolds. Even if you never trade one as-is, reading how a Wyckoff or ICT setup is expressed as explicit rules teaches you how to formalize your own ideas.
- Clone and tweak. The fastest path to an original strategy is importing the closest template and changing one rule at a time, backtesting after each change.
- Performance parameters are historical. Treat the published win rates as a starting benchmark, then verify on your own instrument and timeframe with a fresh backtest. Real fees, spreads, and market conditions will change your true results.
- Open your strategy. Click Backtest.
- Pick a market and some dates. Run it.
- Read the report. Then run Market Simulation to see your worst case.
A backtest runs your strategy on real past prices. Trade by trade. Just as if you were there. At the end you get a full report card. It tells you if the strategy is worth going live with.
Backtest Engine
See how your strategy would have done if you'd been running it in the past. A must-do before trading live.
- Select date range. Choose start and end dates for your historical test period.
- Choose instrument and timeframe. Test on any supported symbol with any chart type.
- Configure risk parameters. Set stop-loss distance, take-profit, lot size, and risk percentage.
- Real-time progress bar shows you exactly how far through the test the engine is.
- Results appear instantly upon completion with comprehensive performance metrics.
Performance Report
After the backtest finishes, you get a detailed report card.
- Net Profit / Net Profit % is the total return in dollars and as a percentage of starting capital.
- Win Rate is the percentage of trades that closed in profit.
- Profit Factor shows how much you made for every dollar you lost. Above 1.5 is generally considered healthy.
- Max Drawdown is the biggest dip your account would have taken from a peak. Lower is better.
- Sharpe Ratio is a score that measures return versus risk. Higher means better risk-adjusted performance.
- Equity Curve is a line chart showing how your account balance would have grown (or dropped) over the entire test period.
- Trade Log lists every individual trade with entry/exit price, profit or loss, duration, and direction.
The numbers aren't a promise.Every figure here comes from testing on past data. Real trading also pays fees and spreads, and market conditions keep changing. Slippage, news, and thin liquidity can all move your true results over time. Treat the report as a guide, not a promise, and check how the strategy does on your own live account.
A backtest shows one path your trades took. But luck plays a part in that order. Market Simulation shuffles the same trades thousands of times. You see the good runs and the bad ones. Now you know your real worst case.
Market Simulation
Shuffle and replay your trades in random order to see how your strategy performs in the best and worst cases.
- Trade sequence randomization shuffles your backtest trades to see how order affects results. The exact same trades can produce wildly different equity curves depending on when winners and losers cluster.
- 1,000+ simulations generate probability distributions of potential outcomes. So you don't just see one possible future, you see the full spread.
- Worst-case scenarios identify maximum drawdown at 95% confidence. Tells you the deepest loss your strategy is likely to hit, not the deepest loss it happened to hit.
- Risk of ruin calculation shows the probability of your account hitting a total drawdown threshold (for example, losing 50% of capital before recovering).
- Confidence intervals show the range of expected returns at different probability levels. So you can plan for both the upside and the downside.
Still based on past data.Market Simulation reshuffles your backtest trades, so it starts from the same past data. It doesn't add real fees, spreads, or changing market conditions. Use it to understand your risk, not as a guarantee of what happens live.
Historical Replay Engine
Pick any day in the past. Watch the market play out just as it did. It feels live. You practice without risking a cent.
- Select any date. Choose a starting point from available historical data for any instrument.
- Bar-by-bar playback lets you watch candles form one at a time, just like live trading.
- Variable speed lets you play back at 1×, 2×, 5×, 10×, 25×, or 50×. Speed up the quiet stretches and slow down for the action.
- Pause and step any time. Pause at any moment, then advance one candle at a time for precision analysis.
- All indicators stay active. Your indicators calculate and update in real-time during replay.
- Practice trades. Execute paper trades during replay to test your decision-making without risking a cent.
Replay Controls
Simple play, pause, and rewind controls. Just like watching a video.
- Play / Pause starts and stops playback with one click or the spacebar.
- Speed selector lets you instantly switch between 6 speed levels (1× to 50×).
- Step forward advances exactly one candle for careful analysis at key moments.
- Progress bar shows how far through the replay data you've moved.
- Equity tracking watches your simulated account balance grow (or shrink) during the replay session.
- Connect a broker. Integrated is fastest.
- Open a strategy you tested. Click Deploy.
- Watch it in Positions. It runs when your computer is off.
The best way to go live is with a broker that has AlgoBars built right in. These brokers run the AlgoBars platform as part of their own service, so everything happens in one place. There's no bridge to set up, and your orders go straight to the market. If your broker is one of them, this is the way to trade.
Why an Integrated Broker Is Better
An integrated broker has added the AlgoBars platform to its own service. You trade through AlgoBars with a direct line to that broker. This is the way the platform was meant to be used live.
- Faster execution. Your orders go straight to the broker with nothing in the middle, so you get quicker, cleaner fills.
- One place for everything. Charts, strategies, deposits, and live trading all sit in AlgoBars. No second app and no second login.
- Better rates. Integrated brokers often come with tighter spreads and lower fees, so more of your profit stays with you.
- Simple setup. No server address or passwords to copy over. Pick your broker and log in.
- The full platform. Ghost Orders, the AI builder, and every tool work right away.
How to Connect
Getting started takes just a few steps.
- Open the broker menu on the sign-in screen.
- Pick an integrated broker from the list.
- Log in, or open an account in a few steps.
- Add funds from your wallet.
- Deploy your strategy. It runs live, hands free.
Not on the list yet?You can still go live. The Broker Bridge connects almost any broker through MT4, MT5, or cTrader. It's the backup when your broker isn't integrated. See the Broker Bridge guide right below.
See the Current List
The list of integrated brokers grows over time. To see who's available right now, open the broker menu on the sign-in screen. Your integrated options show up there, ready to connect.
Built it? Tested it? The Broker Bridge sends it live. It links to MT4, MT5, cTrader, and 200+ brokers. Your strategy runs in our cloud. It keeps trading when your computer is off.
Prefer an integrated brokerIf your broker has AlgoBars built in, use that instead. It's faster and needs no setup. See the Integrated Brokers guide above. The Broker Bridge is for connecting a broker that isn't integrated yet.
Broker Bridge Overview
Send your strategies from AlgoBars to your broker account for hands-free automated trading.
- Connections tab. Add your broker login details here (server, username, and password). Supports MT4, MT5, and cTrader credentials, plus other broker protocols.
- Deployments tab. Pick which strategy to run on which broker connection. Just one click.
- Activity Log tab. A live feed showing every signal sent, every order placed, and every event.
- Connection stats. A quick dashboard showing how many connections are active and how many signals have been sent.
Deployment Workflow
Follow these steps to get your strategy trading live.
- Create connection. Enter your broker details (server address, login, and password). Use the appropriate protocol for your broker (MT4, MT5, or cTrader).
- Select strategy. Pick one of your saved strategies from the Algo Builder.
- Configure settings. Set your trade size, risk limits, and any other preferences.
- Deploy. Click the deploy button and your strategy starts trading automatically on your broker account.
- Monitor. Watch the activity log to see your trades being placed in real time.
- Algo Tokens. Running live strategies uses Algo Tokens. You can top up from your wallet anytime.
Bridge SecurityYour broker login details are fully encrypted and stored securely. The connection is monitored around the clock and reconnects automatically if there's ever a hiccup.
Connecting MetaTrader (MT4 / MT5)
- Open the Live broker dialog and choose Connect MT4/MT5.
- Pick your platform (MT4 or MT5), then find your broker's server with the live server search.
- Enter your account credentials; the first connection asks you to accept the broker-connection agreement (recorded to your account).
- Once connected, the MT account appears in your account picker and syncs automatically.
Funding & Activation
You never hit a dead end for lack of funds. If a setup needs money, you see a Fund Now button. It opens your wallet. It spots your deposit landing. Then it turns on what you were setting up.
- Click the wallet icon in the header.
- Pick a way to add funds. Card, bank, or crypto.
- Your Strategy Build Credits show here too. So does every cost.
The Wallet shows all your money in one place. Your balance. Cash tied up in trades. Anything pending. And your Strategy Build Credits.
Unified Wallet
Click the wallet icon in the header to see everything about your money in one place.
- Total Balance is the combined balance across all currencies, displayed at a glance.
- Available / Free Margin is funds ready to trade, excluding margin currently in use.
- In Positions is capital currently committed as margin for open trades.
- Pending shows deposits awaiting confirmation or withdrawals being processed.
- Algo Token Balance is your token count for running automated strategies. You can top up anytime.
Deposit Methods
Several easy ways to add funds to your account.
- USDT (TRC20) has the lowest fees with fast confirmation on the Tron network. This is the preferred method.
- USDT (ERC20) is the Ethereum network option for ERC-20 compatible wallets.
- BTC (Bitcoin) lets you send Bitcoin directly to your unique deposit address.
- Web3 Wallet connects MetaMask or TronLink directly so you can send from your browser wallet.
- Unique deposit addresses are generated automatically when you request one. Each address is tied to your account.
- Automatic crediting updates your balance on its own once your deposit arrives on the blockchain. No need to refresh.
- Fiat options through your broker. Depending on which broker you connect, you may also be able to deposit via bank transfer, credit card, debit card, Apple Pay, and other fiat methods.
Withdrawals & History
Taking money out is simple. And you can see a full history of everything.
- Select your withdrawal currency and network (TRC20, ERC20, or Bitcoin).
- Enter the destination wallet address and amount. Minimum amounts are enforced per network.
- Full transaction history shows deposits, withdrawals, and Algo Token top-ups with timestamps and status.
- Click any transaction for a detailed view including the network used, transaction ID, status, and amount.
Pricing is simple. Every feature runs on every account, free. The only thing you pay for is Strategy Build Credits, which you top up as you go, with no subscription. Credits decide how much heavy AI work you can run.
It's Free
Free is a real account, not a trial. It includes:
- The complete platform: the same charts, builders, backtesting, and tools a fully topped-up account uses.
- All 100+ indicators, custom AlgoBars chart types, and the community Discord.
- 250 strategy build credits every month, free, forever.
Nothing is locked away. Free runs the full platform, same as any topped-up account. X-Ray Bars. The Indicator Matrix. The MetaTrader bridge. All of it. Your credits just set how much AI work you can run.
Topping Up
Every account already has the whole platform. Top up to add Strategy Build Credits. More credits let the AI build, scan, analyse, and trade at the pace you work. Top up any amount you like, and bigger top-ups earn bonus credits and a lower effective rate. The base rate is 100 credits per $1, and your every credit expires 60 days after it is added, including top-ups.
| Top-up | Credits | Bonus | Per 1,000 credits |
|---|---|---|---|
| $10 | 1,000 | 0% | $10.00 |
| $25 | 2,700 | +8% | $9.26 |
| $50 | 5,750 | +15% | $8.70 |
| $100 (most popular) | 12,000 | +20% | $8.33 |
| $250 | 32,500 | +30% | $7.69 |
| $500 | 70,000 | +40% | $7.14 |
Prefer a set-and-forget setup? Turn on auto-reload and your balance refills itself whenever it runs low, so you never get cut off mid-backtest. It keeps cash-flow predictable like a subscription, but you can switch it off in one tap and you are only ever charged when you actually run low.
Managing Your Balance
- Open the Credits panel in the workspace (the battery indicator in the header shows your remaining balance).
- The Top Up tab shows suggested amounts and a box to enter any amount you like.
- Auto-reload lets you set a threshold and a refill amount so your balance tops itself up automatically. Switch it off any time in one tap, there is no subscription to cancel.
Algo Tokens are now Strategy Build Credits. It's one balance. It pays for the AI work you ask for. Charts, manual trades, backtests, and browsing are always free.
What Credits Pay For
Here is the part that changes everything. Each AI action costs you cents. The same work, done the old way, costs a fortune.
| What you get | The old way | On AlgoBars |
|---|---|---|
| A full trading strategy, built and coded for you | A quant developer. Thousands of dollars. Weeks of waiting. | Under a dollar. A few seconds. |
| A deep market read across every timeframe | An analyst on retainer. | Under a dollar. |
| A live alert the moment your setup hits | A paid signal service, every single month. | Cents. |
| A second opinion before you risk anything | Hours of your own screen time. | Cents. |
You pay the real compute cost and nothing on top. A $100 top-up covers around a hundred AI strategies or full analyses. Just one of those, built the old way, would cost you more than the entire top-up, many times over.
Refill, Rollover, Expiry
- Topped-up credits: yours to keep, with no expiry and no monthly reset.
- Free tier: 250 credits per month, reset monthly with no rollover.
Tracking Every Credit
- Open the Credits panel; the header battery shows your live balance and drains as actions run.
- The Usage tab shows Total Used and Used This Month, plus a paginated log of every charge.
- Each log entry carries a one-word label so you can audit spend at a glance:
Prompt,Analysis,TradeCheck,Strategy,Alert,Test, orTrade.
- Open AlgoSocial.
- Find a trader you like on the leaderboard.
- Click Copy. Set your size and your risk. Done.
AlgoSocial is a social network for traders. And a shop. Traders sell strategies and indicators. They offer copy trading. They post analysis and follow each other. It works on desktop and on mobile.
The Marketplace
- Strategy and indicator listings each get a full detail page: performance history, risk score, equity curve, and creator profile.
- Buying: pay with a saved payment method or directly from your AlgoBars wallet balance. After purchase you can deploy immediately; if your trading account needs funding first, a guided activation flow walks you from Fund Now to running with no dead ends.
- Creator economics: 80% to the creator, 20% to AlgoBars on every marketplace sale.
Creator Earnings Dashboard
Sellers see all earnings in one view. Your balance and your totals. Split by strategies, indicators, and copy trading. Pick a window: 24 hours, 7 days, 30 days, 3 months, or your own. It all pays out to your wallet.
Getting Started
- Open AlgoSocial while logged in. First-time visitors claim a unique username with a live availability check; that becomes your public profile.
- Browse the feed, marketplace, and copy-trading sections, or publish your own work from your profile.
Share & Earn Everywhere
Every Share button opens one box. You see a preview. You can edit the message before it goes out. You get a real QR code. Post to X, WhatsApp, Telegram, Reddit, Facebook, LinkedIn, Instagram, or TikTok in one tap. Discord copies the message for you, Email opens a draft, and More hands off to your device's own share sheet. Every link carries your referral code. So anything you share can earn you money. You set up nothing.
Copy trading works both ways. Copy a Master Trader and their trades land in your account. Or become one and earn fees from your copiers. Set it up from AlgoBars AI (Automations Profile Copy-Trade), AlgoSocial desktop, and mobile.
Copying a Master Trader
- Browse Copy Trade in AlgoSocial or open any master's profile, and review their published stats: risk score, max drawdown, and trade count.
- Accept the copy-trading agreement (shown once, recorded to your account).
- Pick the trading account that will do the copying and confirm the master's terms.
- If the account needs funding, the guided activation flow takes over: Fund Now opens the wallet's Deposit tab, the deposit is detected automatically, and copying activates.
- Stop any time with Stop Copying. Before you confirm, you see exactly what you'll be charged and what you get back. Open positions close at the market price of the moment. If the master set an early-termination fee, you see that in the same preview.
Becoming a Master Trader
- One Master Trader per trading account: pick the account whose trades will be mirrored.
- Performance fee: your cut of copier profits (defaults to 20%).
- Early-termination fee: 0-10%, enforced server-side, for copiers who leave early.
- Minimum copier balance: optionally require a floor before someone can copy you.
- Three independent disclosure levels: what shows on your public page, what live copiers can see, and what remains visible after termination.
- Deleting a master profile is soft (it frees the trading account) and is refused while copiers are still live.
Staying Informed
You get strategy reports on how your master trades. If they change their terms, we tell you. You must accept again before copying goes on. Terms never change behind your back.
Let the platform watch the market for you. It pings your phone when your setup hits. Price levels. Indicator extremes. Candle patterns. Chart patterns. Pick what matters to you. Get it on Telegram, Discord, or in the app.
Alert System
Set up alerts so the platform watches the market for you. You'll get notified when your conditions are met.
- Price alerts trigger when price crosses above, below, or touches a specific level.
- Indicator alerts notify you when RSI hits oversold, MACD crosses, or Bollinger Band squeeze triggers.
- Pattern alerts send automatic notifications when candlestick or chart patterns are detected.
- Recurring mode lets alerts reset after triggering, so they fire every time the condition is met.
- Trigger count and last triggered time are tracked for every alert. So you can see exactly how often each one has fired.
Notification Channels
Choose how you want to receive your alerts.
- Telegram Integration. Connect your Telegram bot and alerts arrive in seconds.
- Discord Webhooks. Post alerts to any Discord channel via webhook URL.
- In-App Notifications. A bell icon in the platform shows notification history within the app.
- All notifications include symbol, price, condition, and timestamp for quick action.
Some topics are pure theory. They have their own pages. That keeps this guide about using the platform.
- See what brokers get.
- $97 a month, plus $3 an account and $1 a lot.
- Talk to us. Your brand goes live in a day.
Resell the whole platform under your own name. Your cost is a flat $97 a month for the licence, plus two usage lines: $3 per active account (or its compute, if greater) and $1 per lot. Nothing else to itemize. You set your own prices and keep 100% of your desired markup. There is zero setup fee. Branding, mobile apps, KYC, and complete admin-module CRM that can be integrated into your current systems all come with it.
What Brokers Get
A complete brokerage, already built. Every line below ships in every deployment, at no extra cost.
The trading platform
A full trading platform with order execution and liquidity built in, ready to run the day you launch. This is the part that wins traders and keeps them.
- Web, desktop and mobile. iOS and Android, all under your brand. Nothing to install on the web. Up to 16 charts on desktop.
- 1,000+ markets across every asset class, with 100+ indicators and 100+ AI-detected patterns.
- AlgoBuilder. Your traders type an idea in plain English and the AI writes the strategy. No code. No quant team. Anyone can automate.
- Range Bars and X-Ray Bars. Chart types no competing white-label platform can offer.
- Replay Engine. Watch any strategy trade months of history candle by candle at up to 50x. Your sales desk can close a client in two minutes without ever giving advice.
- Ghost Orders. Entries, stops and targets held server-side and hidden from the order book. No stop hunting.
- AI Market Scanner. 100+ Smart Money patterns painted live across every market you list.
- Backtesting and Market Simulation. Candle-by-candle testing, then a thousand what-if runs.
- Sub-2ms execution.
Execution and connectivity
- MT4, MT5 and cTrader bridges.
- 200+ brokers and 45+ prop firms.
- Optional FIX, OMS and REST connectivity, scoped on request.
Your brand
- Your domain, logo and colours.
- Branded mobile apps for iOS and Android, a branded desktop app, and branded email notifications.
- Live in under 24 hours. Add your brand kit and go live the same day. No build. No integration project.
Admin, CRM and compliance
- Complete Client Management Admin-Suite with role-based operator controls.
- Users and KYC tracking, 2FA, session management, IP tracking, and multi-broker account isolation.
- Deposits, withdrawals and crypto payment systems integrated. BTC, ETH, USDT, USDC and more across 7 networks, with manual deposit handling and withdrawal approval.
- Subscriptions and MRR connection.
- Live trades monitor, risk controls and audit logs.
- Leverage tiers from 1:1 to 1:500.
Growth
- A full IB and affiliate portal, already built. Not just tracking. Your partners get their own portal with an Overview, a Referrals list, and a Commissions ledger. They see total earned, total referrals, and their live balance in one place, and move earnings straight into their wallet. You set the commission rates.
- Referral codes ride along on their own. Every link shared from anywhere in the platform carries the referrer's code automatically, so your partners set nothing up.
- Copy trading, PAMM and MAM.
- Strategy marketplace.
- Revenue and analytics dashboards.
Two things brokers ask about firstYour desk gives no advice. Clients build and deploy their own strategies. You provide the tools, never the recommendation. And your dormant book wakes up. Idle accounts come back the moment they can automate, turning dead weight into active volume.
Pricing
We believe in simple pricing. See AlgoBars pricing.
What Your Licence Covers
Everything below ships in every deployment at no extra cost. Compute, AI, and data are built into the per-account rate.
- Full white-label branding
- Broker admin CRM
- Unlimited trader accounts
- Copy trading, PAMM and MAM
- MT4, MT5 and cTrader bridges
- AlgoBuilder and X-Ray Range Bars
- AI strategy generation
- Historical and backtest data
- Strategy marketplace
- KYC, 2FA and compliance tools
- Affiliate and IB tracking
- Analytics dashboard
Commercial Terms
- Licence. $97/mo flat, broker-wide, billed monthly in advance.
- Trial. The licence starts after 30 days, or at your first live account.
- Setup fee. None. No onboarding or integration charge.
- Usage billing. $3 per active account (or its compute, whichever is greater) and $1 per lot, monthly in arrears.
- Currency. All amounts in USD, exclusive of taxes.
- Add-ons. Optional FIX, OMS, and REST connectivity, scoped on request.
Regulatory positioningAlgoBars provides metered access to platform infrastructure as a technology licensor, not a broker-dealer or revenue-share partner. Fees are calculated on consumption and owed regardless of the Partner's own pricing, marketing, or revenue model. The Partner is solely responsible for its retail pricing and end-user relationships.
Broker Admin Panel
Every broker gets a full 17-module CRM-style admin panel to run the brokerage end-to-end.
- Dashboard. Overview of users, deposits, withdrawals, trades, volume, revenue, and AUM with interactive charts.
- Users. Full user management with search, filtering, and individual user detail popups (trade history, transfers, reports, CSV export).
- Leads. Track new sign-ups and the conversion funnel.
- Transactions. View all deposits and withdrawals, approve or reject withdrawal requests, and add manual deposits.
- Trades. Monitor every open and closed trade across all your traders.
- Markets. Configure available instruments and set custom spreads, swaps, and commission fees.
- Affiliates. Manage your affiliate program with commission tracking.
- KYC. Review uploaded identity documents, approve or reject, and track verification status.
- CRM Audit Log. Session-grouped activity log of every admin action for compliance and audit trails.
- Date range controls. Filter everything by 1 day, 1 week, 1 month, 3 months, 6 months, 1 year, or 5 years.
How to Get Started
- Visit algobars.com/pricing and click the Brokers tab.
- Click Book a Broker Demo to walk through the platform with our team.
- Custom branding can typically be configured within 24 hours of approval.
© 2026 AlgoBars · All rights reserved · 12 sections · Updated May 2026
No guides match ""