Indicator Matrix
Mix and match existing indicators. Fuse 2+ into custom signals. 8 blend modes, 6 visualization types, zero coding. Build indicators no one else has. Then use them in your algo strategies.
Concept
What is the Indicator Matrix?
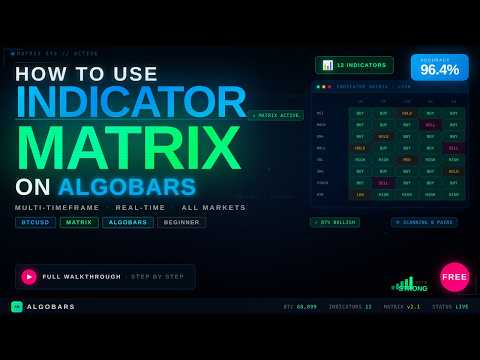
The Indicator Matrix lets you fuse two or more existing indicators into one brand new custom indicator. Think of it like mixing paint colors. You take indicators you already know and blend them into something unique that no one else has.
Fuse Indicators
Combine any 2+ existing indicators into one custom signal. Like mixing paint. Blend RSI with CCI, MACD with Bollinger, or any combination you imagine.
Choose Outputs
Pick exactly which part of each indicator you want. Use just the RSI value, just the MACD histogram, or just the upper Bollinger Band. Total control.
Save & Deploy
Save to cloud, available across all devices. Use your custom indicators in Algo Builder strategies. Share via AlgoSocial.
Key Features
Build Your First Custom Indicator
Create something no one else has. Fuse any combination of indicators into a single custom signal , your unique edge in the market.
Steps 1 to 3
looks_oneOpen Algo Builder from the Command Center on the left or top menu, then click the "Indicator Matrix" tab at the top
Click "Add Layer" to add your first indicator. Pick from the full list , SMA, EMA, RSI, MACD, Bollinger Bands, Stochastic, and many more
Choose which output you want from that indicator. For example, MACD has three outputs: MACD Line, Signal Line, and Histogram. Pick the one you need
Steps 4 to 6
4. Set the parameters (like period length) and give the layer a color so you can identify it
5. Add a second layer (or more!) by clicking "Add Layer" again and picking another indicator
6. Choose a Blend Mode. This controls how the layers combine together (8 modes available)
Steps 7 to 9
7. Adjust the weight of each layer if you want one indicator to have more influence than the other (e.g. 70% RSI + 30% CCI)
8. Pick a visualization style. Line, Area, Bars, Histogram, Dots, or Step
9. Give it a name and click Save. Your custom indicator is now available to use on any chart!
Blend Modes
8 Ways to Fuse Signals
Blend Modes. How Layers Combine
The blend mode controls the math behind how your indicator layers merge. Each unlocks a different edge.
Average
Takes the middle value of all layers. Great for smoothing two signals into one balanced output.
Weighted
Same as average, but you control how much weight each layer gets. Set 70% RSI + 30% CCI to prioritize momentum over cycle. Full control over signal balance.
Difference
Subtracts one indicator from another. Shows the gap between two signals. When they agree the difference is small, when they diverge it spikes. Great for spotting divergences.
Multiply
Multiplies the layers together. When both indicators point the same direction, the output amplifies. When they disagree, it suppresses. A natural confluence filter.
Ratio
Divides one indicator by another. Shows the relative strength between two indicators. Useful for comparing momentum across timeframes or asset pairs.
Maximum
At each point, takes whichever indicator has the highest value. An aggressive approach. You always see the most bullish read between your layers.
Minimum
At each point, takes whichever indicator has the lowest value. A conservative approach. You only act when both indicators agree on a low reading.
Crossover
Detects the exact moment when one layer crosses above or below another. Outputs a +1 or -1 signal at the crossing point. Perfect for entry/exit triggers.
Visualization
6 Ways to See Your Signal
Choose how your custom indicator renders on the chart. Each style suits different analysis approaches.
- check_circleLine. Smooth continuous curve for tracking blended signal over time
- check_circleArea. Filled region under the curve highlighting signal strength zones
- check_circleBars. Vertical bar for each candle showing discrete blended values
- check_circleHistogram. Positive/negative columns perfect for divergence and momentum reads
- check_circleDots. Scatter plot of discrete values for spotting clusters and outliers
- check_circleStep. Stepped line that holds its value until the next change, great for threshold signals
Extra Capabilities
Formula View
As you build, the platform shows you the mathematical formula in real-time. E.g. Avg(RSI(14), CCI(20)). See exactly what math is happening behind your custom indicator.
Auto Short Name
A compact label is generated automatically so your indicator fits neatly on the chart legend. No need to manually create abbreviations.
Auto-Placement
The system figures out if your indicator belongs on the main price chart (like a moving average overlay) or in a separate panel below (like an oscillator). Automatic and smart.
Edit & Delete
Manage your library of custom indicators anytime. Edit the layers, change colors, adjust weights, rename, or delete ones you no longer need.
Use in Algo Builder
Once saved, your custom indicators can be used as conditions inside your Algo Builder trading strategies. Build algos with signals no one else has access to.
Publish to AlgoSocial
Publish your custom indicators to AlgoSocial for the community to discover, copy trade, and use. Or keep them private for your own edge.
Plus Feature
The Indicator Matrix is free on AlgoBars. The full Indicator Matrix , including saving, deploying, and live execution of custom indicators , is exclusive to Plus subscribers. Premium includes 1,000 Algo Tokens and full access to all 100+ indicators, 8 blend modes, and 6 visualization types.
Get Premium AccessBuild Indicators No One Else Has
100+ indicators. 8 blend modes. 6 visualization types. Zero coding. Free on AlgoBars.
Free • 100+ Indicators • For Everyone
 AlgoBars